What is Integrated Demand Forecasting in Fashion Retail?
Introduction
Demand forecasting and inventory optimization are two key concepts in modern retail supply chain management. This blog explains how machine learning can be used to improve demand forecasting and integrate it with inventory optimization to reduce stockouts and improve efficiency.
Integrated demand forecasting in the fashion retail industry refers to the process of combining multiple data sources, business functions, and analytical techniques to accurately predict future customer demand for clothing, footwear, accessories, and other fashion products.
Why Integrated Forecasting Matters
The fashion industry is highly dynamic and trend-driven. Consumer preferences change rapidly, product life cycles are short, and demand can fluctuate significantly across regions, seasons, and sales channels.
An effective integrated forecasting system helps retailers:
- Reduce stockouts and lost sales
- Minimize overstock and markdown losses
- Improve inventory planning
- Enhance customer satisfaction
- Optimize merchandising and replenishment decisions
- Increase operational efficiency and profitability
With accurate forecasting, brands can respond faster to changing market trends while maintaining the right inventory levels at the right locations.
Why Forecasting is More Challenging in Fashion Retail
Demand forecasting in the fashion industry is significantly more complex than in many other sectors. Fashion retailers deal with rapidly changing consumer preferences, short product life cycles, seasonal trends, and a massive variety of products across different styles, colors, and sizes.
Unlike industries with stable demand patterns, fashion demand is highly unpredictable and influenced by several dynamic factors, including:
- Seasonal trends and holiday demand
- Fast-changing fashion preferences
- Regional buying behavior
- Online and offline sales channels
- Weather conditions
- Promotional campaigns and discounts
- Social media influence and customer sentiment
As a result, forecasting customer demand accurately becomes a major challenge for retailers.
Traditional Forecasting Challenges in Retail
Traditionally, retailers used separate forecasting processes across departments such as merchandising, operations, finance, and regional stores. These forecasting methods were often fragmented and inconsistent.
For example:
- Regional stores followed a bottom-up forecasting approach based on local sales expectations
- Corporate teams used top-down forecasting based on overall company targets
As a result, businesses frequently faced:
- Conflicting forecasts
- Poor coordination between teams
- Inaccurate inventory planning
- Inefficient replenishment decisions
This lack of integration created operational challenges and reduced forecasting accuracy.
Example: Forecasting a New Fashion Product
Consider a fashion brand launching a new jacket design.
Traditionally, merchandising teams would estimate expected sales by comparing the new jacket with similar products sold in previous seasons. However, this method has several limitations because demand can also be influenced by external factors such as:
- Retailer buying decisions
- Market competition
- Social media trends
- Influencer marketing
- Economic conditions
- Weather fluctuations
For instance, large retail partners may initially place high-volume orders and later adjust future purchases depending on early sales performance.
Because of these uncertainties, forecasting demand for entirely new products remains one of the most difficult challenges in fashion retail.
The Growing Importance of Data in Fashion Forecasting
Modern fashion retail generates enormous volumes of data from multiple sources. This data plays a critical role in business decision-making and directly impacts:
- Merchandising strategies
- Inventory planning
- Replenishment decisions
- Marketing campaigns
- Workforce planning
- Store expansion and budgeting
Accurate demand forecasting helps companies avoid both stockouts and overstock situations while improving operational efficiency and profitability.
Shift Toward Data-Driven Forecasting
To overcome these limitations, modern fashion retailers are increasingly centralizing their forecasting functions and adopting automated, statistical, and AI-driven forecasting models.
Instead of relying solely on manual estimates or simple historical extrapolation, companies now use:
- Machine learning algorithms
- Predictive analytics
- Demand sensing systems
- Real-time customer data
- Advanced supply chain analytics
These technologies improve forecast accuracy, enhance responsiveness to market changes, and support smarter inventory optimization strategies.
Modern Forecasting Uses Multiple Data Sources
Today, fashion companies use advanced forecasting systems powered by machine learning, predictive analytics, and artificial intelligence to improve forecast accuracy.
These systems combine both structured and unstructured data from internal and external sources.
Types of Data Used in Fashion Forecasting
| Source Type | Structured Data | Unstructured Data |
|---|---|---|
| Internal Data | Historical sales, inventory, product attributes, seasonal products | Website activity, marketing campaigns |
| External Data | Weather, demographics, customer sentiment | Social media posts, image recognition, natural language processing |
This integrated approach allows retailers to generate more accurate and dynamic demand forecasts.
Rise of Omnichannel Retail and Demand Sensing
In today’s digital retail environment, customers can purchase products from anywhere in the world through ecommerce platforms and mobile applications. Demand generation and product fulfillment are no longer limited to physical store locations.
As a result, modern forecasting systems are evolving toward demand sensing — a real-time forecasting approach that continuously incorporates customer behavior and market signals into the forecasting process.
Demand sensing uses:
- Customer browsing behavior
- Online search trends
- Real-time sales transactions
- Social media engagement
- Market sentiment analysis
This enables fashion retailers to react faster to changing customer preferences and market trends.
Role of Advanced Forecasting Tools
Modern supply chain and forecasting platforms can generate highly detailed forecasts at:
- Product level
- Store level
- Regional level
- Daily or weekly intervals
These tools also account for:
- Holidays and seasonal events
- Customer demographics
- Shopping patterns
- Promotional campaigns
- Weather conditions
Advanced forecasting systems can even identify lost sales opportunities caused by:
- Stock shortages
- Missing product sizes or colors
- Delayed replenishment
- Competitive pressure
This level of visibility helps companies optimize inventory allocation and improve customer satisfaction.
Impact on Supply Chain Planning
Accurate demand forecasting improves planning across the entire supply chain, including:
- Retail stores
- Warehouses
- Distribution centers
- Customer service teams
- Workforce management
Better forecasting allows businesses to:
- Maintain optimal inventory levels
- Improve fulfillment efficiency
- Reduce operational costs
- Enhance customer experience
Real-World Business Example
Imagine a knitwear company forecasting that demand for sweaters will increase four times during the December holiday season.
Using forecasting analytics, the company can:
- Increase store inventory in advance
- Hire additional warehouse staff
- Strengthen customer support operations
- Prepare logistics and replenishment plans
As a result, the business can handle increased demand efficiently while improving profitability and customer satisfaction.
For example, a well-executed forecasting and inventory strategy could increase holiday-season profits significantly by reducing lost sales and improving stock availability.
What is Inventory Optimization?
Introduction
Inventory optimization is the process of ensuring that the right products are available in the right quantity, at the right location, and at the right time — while minimizing overall inventory-related costs.
In the fashion retail industry, inventory optimization is essential because customer demand changes rapidly due to trends, seasonality, promotions, and shifting consumer preferences.
An effective inventory optimization strategy helps retailers maintain product availability without carrying excessive stock.
Key Objectives of Inventory Optimization
Inventory optimization aims to balance several important business factors:
- Customer demand
- Product availability
- Holding costs (warehouse and storage costs)
- Ordering and transportation costs
- Service level targets
- Supply chain efficiency
The primary goal is to reduce inventory waste while ensuring customers can purchase products when needed.
Relationship Between Demand Forecasting and Inventory Optimization
Demand forecasting and inventory optimization work closely together in retail operations.
Demand Forecasting
Predicts how many units customers are expected to purchase during a future period.
Inventory Optimization
Determines how many units a company should order, store, and replenish to meet that forecasted demand efficiently.
Together, these processes help retailers avoid two major inventory problems:
Overstock
Excess inventory leading to:
- High storage costs
- Heavy markdowns
- Dead stock
- Reduced profitability
Stockouts
Insufficient inventory leading to:
- Lost sales
- Poor customer experience
- Lower customer loyalty
- Missed revenue opportunities
Important Retail Inventory Concepts
1. Demand During Lead Time (DDLT)
Demand During Lead Time (DDLT) refers to the amount of inventory expected to be sold while waiting for replenishment stock to arrive.
For example:
- A retailer sells 10 T-shirts per day
- New inventory takes 7 days to arrive after ordering
The expected demand during the lead time is:
DDLT=Daily Demand × Lead Time
DDLT=10×7=70 units
This means the retailer should maintain at least 70 units to cover customer demand during the replenishment period.
02. Forecast Error (σ)
Forecast error measures the variability or uncertainty between predicted demand and actual demand.
In retail forecasting, actual sales rarely match forecasts perfectly.
For example:
- Forecasted demand = 100 units
- Actual demand may vary between 90 and 110 units
The variability between forecasted and actual demand represents forecast error.
Higher forecast uncertainty increases the risk of stockouts, which means businesses need additional safety stock.
03. Safety Stock (SS)
Safety stock is extra inventory kept as a buffer against unexpected demand increases or supply delays.
It protects retailers from:
- Sudden demand spikes
- Supplier delays
- Forecast inaccuracies
- Stock shortages
The standard retail safety stock formula is:
SS=Z×σ×√Lead Time
Where:
- Z = desired service level factor (1.65 ≈ 95% service level)
- σ = forecast error (standard deviation)
- Lead Time = replenishment time
Example:
- Z = 1.65 (95% service target)
- σ = 10 units
- Lead time = 7 days
SS=1.65×10×√7 ≈ 43.7 ≈ 44 units
The retailer should keep an additional 44 units as safety stock.
04. Reorder Point (ROP)
The reorder point is the inventory level at which a company should place a replenishment order.
This ensures that new inventory arrives before stock runs out.
The formula is: ROP = DDLT+Safety Stock
Example:
If:
- DDLT = 70 units
- Safety Stock = 44 units
ROP=70+44=114 units
When inventory drops to 114 units, the retailer should place a new order immediately.
05. Economic Order Quantity (EOQ)
Economic Order Quantity (EOQ) calculates the optimal order size that minimizes:
- Inventory holding costs
- Ordering costs
The EOQ model helps businesses balance ordering frequency with storage efficiency.
The formula is: EOQ= √(2DS / H)
Where:
- D = annual demand
- S = cost per order (administration, transport)
- H = holding cost per unit per year
Example:
Assume:
- Annual demand = 12,000 units
- Ordering cost = £30 per order
- Holding cost = £9.6 per unit annually
EOQ=2√(12000)(30)/9.6 ≈ 274 units
This means ordering approximately 274 T-shirts per shipment minimizes total inventory costs.
06. Service Level
Service level represents the probability of meeting customer demand without experiencing a stockout.
In retail, companies define a target service level based on customer expectations and business strategy.
For example:
- 95% service level means the retailer aims to satisfy customer demand 95% of the time without running out of stock.
Higher service levels:
- improve customer satisfaction
- reduce lost sales
- require higher safety stock
Lower service levels:
- reduce inventory cost
- increase stockout risk
Common Retail Service Levels
| Service Level | Z-Score |
|---|---|
| 90% | 1.28 |
| 95% | 1.65 |
| 99% | 2.33 |
07. Lead Time
Lead time is the total time required for inventory replenishment after placing an order.
It includes:
- Supplier processing time
- Manufacturing time
- Transportation time
- Warehouse receiving time
Example:
If a retailer orders jackets today and receives them after 7 days, the lead time is 7 days.
Longer lead times increase:
- uncertainty
- safety stock requirements
- inventory risk
08. Stock Keeping Unit (SKU)
A Stock Keeping Unit (SKU) is a unique identifier assigned to each product variation.
In fashion retail, a single product may have multiple SKUs because of:
- size
- color
- style
- fit
Example:
A black T-shirt available in:
- Small
- Medium
- Large
creates three separate SKUs.
Fashion retailers often manage thousands of SKUs simultaneously, making forecasting and inventory optimization more complex.
09. Inventory Turnover
Inventory turnover measures how efficiently inventory is sold and replenished over a specific period.
The formula is: Inventory Turnover =Cost of Goods Sold / Average Inventory
Higher inventory turnover generally indicates:
- strong sales
- efficient inventory management
Low turnover may indicate:
- overstocking
- weak demand
- obsolete inventory
10. Fill Rate
Fill rate measures the percentage of customer demand fulfilled immediately from available inventory.
Example:
- Customer orders: 100 units
- Retailer ships immediately: 92 units
Fill Rate = 92%
Higher fill rates improve:
- customer satisfaction
- loyalty
- operational performance
11. Sell-Through Rate
Sell-through rate measures how much inventory is sold compared to how much inventory was received.
The formula is: Sell Through Rate = (Units Sold / Units Received)×100
Example:
- Received 500 jackets
- Sold 400 jackets
Sell-through rate = 80%
Fashion retailers use this metric to evaluate:
- a-start=”3503″ data-end=”3569″>
- =”3523″>product popularity
- trend performance
- replenishment decisions
</ul>
a
- -start=”3624″ data-end=”3641″>
12. Dead Stock
Dead stock refers to inventory that remains unsold for a long period and is unlikely to be sold at normal price.
- <p data-start=”3757″ data-end=”3776″>Dead stock creates:
- storage cost
- markdown losses
- reduced cash flow
Fashion retailers face high dead stock risk because trends change rapidly.
13. Backorder
A backorder occurs when customer demand exceeds available inventory, but the retailer still accepts the order and fulfills it later after replenishment.
Frequent backorders may indicate:
- poor forecasting
- insufficient safety stock
- supply chain delays
14. Demand Variability
Demand variability refers to fluctuations in customer demand over time.
Fashion retail experiences high demand variability due to:
- seasonality
- trends
- promotions
- weather
- social media influence
Higher variability increases forecasting complexity and inventory risk.
15. Bullwhip Effect
The bullwhip effect occurs when small changes in customer demand create increasingly larger demand fluctuations across the supply chain.
This can lead to:
- excess inventory
- stock shortages
- inefficient production planning
Integrated forecasting helps reduce the bullwhip effect by improving visibility across the supply chain.
Data Science in Demand Forecasting
Data science and machine learning are widely used across industries, including fashion retail, to improve demand forecasting and support better business decisions. These methods help companies predict future demand more accurately and optimize inventory, pricing, and supply chain operations.
Demand forecasting using data science typically follows a structured workflow from problem definition to model deployment.
1. Problem Definition and Metrics
The first step is clearly defining what needs to be predicted, such as product-level or store-level demand.
Model performance is evaluated using metrics like:
- MAE (Mean Absolute Error)
- RMSE (Root Mean Squared Error)
- MAPE (Mean Absolute Percentage Error)
These metrics measure how close predictions are to actual sales and ensure reliable forecasting.
2. Data Preparation and Feature Engineering
Raw data is cleaned and transformed before modeling. This includes handling missing values and ensuring consistency.
Feature engineering is used to improve model accuracy by creating useful variables such as:
- Historical sales (lag features)
- Seasonal patterns
- Pricing and promotions
- Calendar effects (holidays, weekdays)
3. Model Selection
Different models are used depending on the problem:
- Time Series Models – capture trends and seasonality
- Regression Models – predict demand using multiple factors
- Tree-Based Models – handle complex relationships (e.g., XGBoost, Random Forest)
- Neural Networks – used for advanced pattern recognition
The choice depends on the accuracy needs, interpretability, and data complexity.
4. Industry Use Case
This framework is widely used in fashion retail to manage fast-changing demand and short product life cycles.
Examples of fashion brands that are using data science for demand forecasting-
Zara:
- Zara collaborates with MIT to enhance demand forecasting by studying factors like seasonality and product life cycles, aiming to implement data-driven techniques for both short and long-term predictions.
- The majority of Zara’s sales occur within the first few weeks of a product’s life cycle, emphasizing the importance of efficient forecasting for timely inventory management and product placement strategies.
L’Oréal:
- L’Oréal implements a beauty tech program for demand sensing, utilizing machine learning and consumer data to enhance forecasting accuracy, exemplified by tools like Lancome Shade Finder, which recommends foundation shades based on consumer insights.
- This initiative involves cross-functional collaboration, integrating teams from data science, marketing, and supply chain, highlighting the importance of unified forecasting efforts across departments for effective planning and distribution optimization.
Real-World Project: Demand Forecasting & Inventory Optimization
This project demonstrates an end-to-end supply chain analytics framework that integrates demand forecasting with inventory optimization using the M5 dataset.
Instead of treating forecasting as a standalone task, the project connects prediction accuracy directly with inventory decisions and business KPIs, showing real operational impact.
Project Overview
The goal is to build a forecast-driven inventory system that improves:
- Demand prediction accuracy
- Stock availability
- Inventory cost efficiency
- Overall supply chain performance
Multiple forecasting models (statistical, machine learning, and deep learning) are evaluated, and the best model is used for inventory simulation.
Dataset Used
M5 Forecasting Dataset
- Daily sales at item-store level
- Calendar features (holidays, events, seasonality)
- Price data
Workflow Summary
1. Forecasting Models
- SARIMA, Holt-Winters (statistical)
- XGBoost, LightGBM, CatBoost (ML)
- LSTM (deep learning benchmark)
✔ Best model: CatBoost
2. Feature Engineering
- Lag features (1, 7, 14, 28 days)
- Rolling averages
- Calendar & event features
- Price & promotion data
3. Inventory Optimization
Two policies compared:
Baseline Model
- Historical average demand
Forecast-Driven Model
- Uses ML predictions for ordering decisions
Key Formulas:
ROP=(Forecasted Demand×Lead Time)+Safety Stock
Q=Forecasted Demand×Lead Time
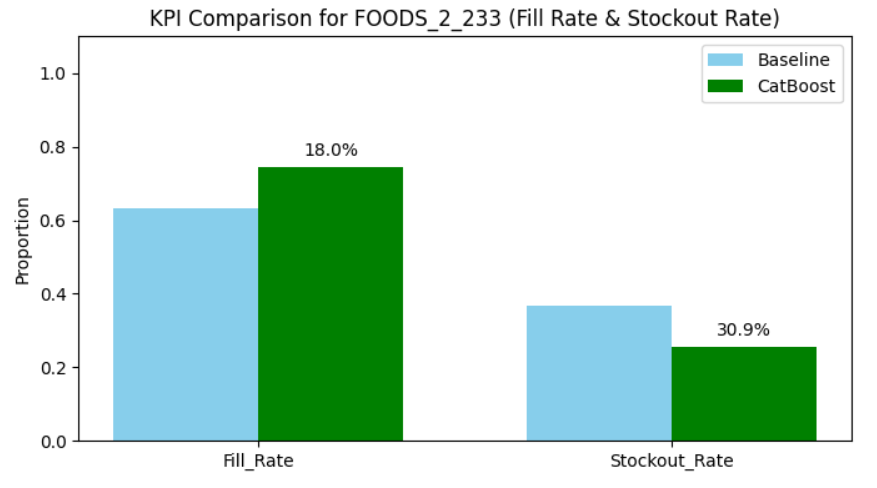
Key Results
- ML models outperform statistical models
- CatBoost gives best forecasting accuracy
- Forecast-driven inventory improves:
- Service level
- Stock availability
- Cost efficiency
- Inventory turnover
GitHub Repository:
Visit this link for the full project python code : https://github.com/MasudRana2406/Integrating-Demand-Forecasting-and-Inventory-Optimization.git
Reference:
Udemy (2022) Data Analytics and Applications in the Fashion Industry. Online course. Available at: https://www.udemy.com/course/data-analytics-and-applications-in-the-fashion-industry/
Doğan, A. (2025) “Time Series-Based Demand Forecasting: A Comparative Analysis of Holt-Winters, SARIMA, and Prophet Models on Retail Inventory Data,” İstanbul Ticaret Üniversitesi Sosyal Bilimler Dergisi, 24(53), pp. 641–668. Available at: https://doi.org/10.46928/iticusbe.1725584.
Seyedan, M., Mafakheri, F. and Wang, C. (2023) “Order-up-to-level inventory optimization model using time-series demand forecasting with ensemble deep learning,” Supply Chain Analytics, 3, p. 100024. Available at: https://doi.org/10.1016/j.sca.2023.100024.
Tang, W. (2024) “Improvement of Inventory Management and Demand Forecasting by Big Data Analytics in Supply Chain,” Applied Mathematics and Nonlinear Sciences, 9(1). Available at: https://doi.org/10.2478/amns-2024-2213.
